Vibe Analytics A Vibe Analytics product

See exactly how your audience feels: second by second.

A Vibe Study gives you real emotional data from real viewers at any stage of the creative process. You'll know what's working, what's killing momentum, and exactly what to do about it. Before you find out the hard way.

Vibe Analytics
Vibe Study Report
Gen Pop · 50 viewers · 3 assets
Above Avg
Vibe Resonance Score 78.2
Attention Score 82.3
Emotional Quality
Warm and aspirational
s12–18: Human-centered payoff peaks valence at +100. Keep.
s22–27: Brand card lands in emotional trough. Reorder for impact.
When to use it

A Vibe Study fits wherever you are in the creative process.

Most studies serve one moment. A Vibe Study serves four. Each has a different question, a different depth, and a different set of decisions riding on the answer.

Stage 1: Concept & Messaging
Before you commit to production

"Three directions. Two opinions. The agency presents Tuesday. You're picking based on whoever argues best in the room."

Test multiple creative concepts, slogans, or messaging directions with real audiences before a single dollar goes to production. Find out which direction has emotional legs, which one dies on arrival, and know all of it before you've committed to shooting it.

What you walk away with
Vibe Resonance Score per concept
Emotional comparison across directions
Clear recommendation on which to develop
Stage 2: Creative Deep-Dive
When the edit is done and everyone likes it

"Everyone likes it. But 'everyone likes it' has burned you before. You can't afford to find out the hard way this time."

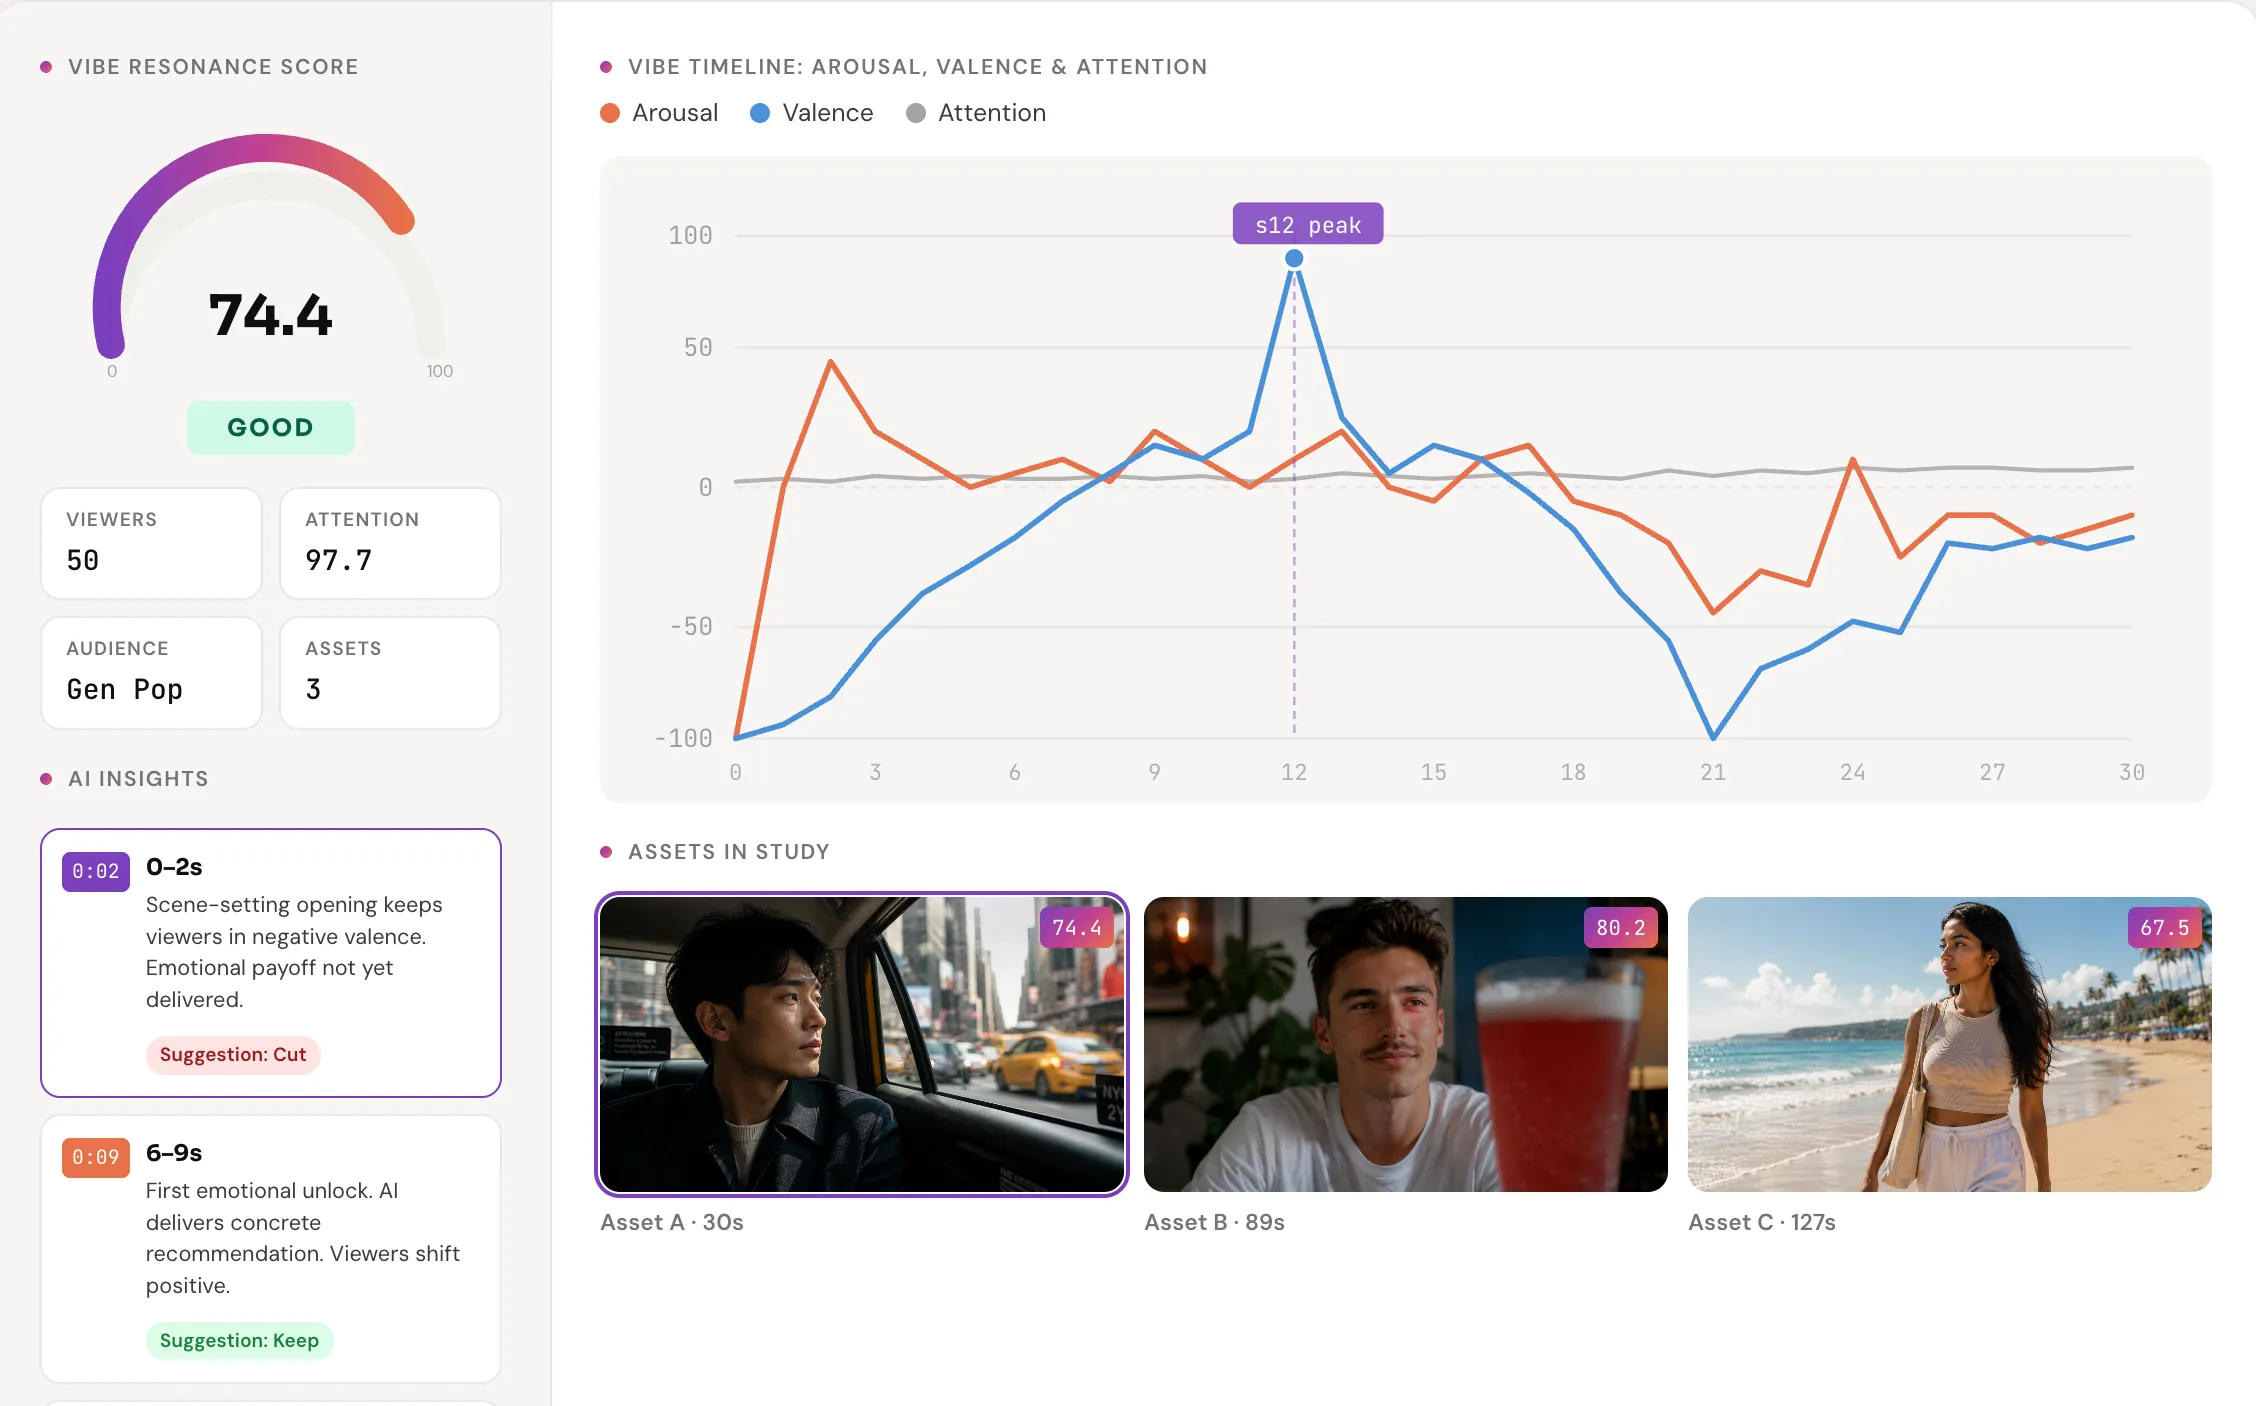
The most comprehensive Vibe Study. A second-by-second emotional map of your finished creative: every peak, every drop, every moment where the audience leaned in or checked out. Your editor gets a precise KEEP/CUT brief. Your strategist gets the why.

What you walk away with
Full second-by-second emotional journey
Timestamped KEEP / CUT guidance
Vibe Resonance Score + strategic recommendations
Stage 3: Post-Launch Learning
After the campaign runs

"ROAS was okay. Your boss wants to know why. Nobody's done a real post-mortem. The next brief starts from the same guesses."

Turn campaign performance data into creative intelligence. A post-launch Vibe Study tells you which moments actually drove emotional response, which scenes fell flat, and what your audience was really reacting to. The next brief starts from truth, not assumption.

What you walk away with
What drove resonance vs. what didn't
Audience-specific emotional response
Clear inputs for the next brief
Stage 4: Specific Question
When you know exactly what you need to know

"I don't need a full audit. I have one precise question and I need emotional data to answer it."

Not every creative challenge needs a comprehensive study. Sometimes you have a specific hypothesis: a hook you suspect isn't landing, a cut-down decision to make, an audience segment you want to understand differently. A Vibe Study scoped to your question gives you focused emotional data without the overhead of a full deep dive.

Example questions
"Is our opening hook strong enough for social?"
"Which 30 seconds of this 60-second spot are actually working?"
"Does this land differently with Gen Z vs. Millennials?"
"Where exactly does our audience check out?"
How it works

Three steps. Five business days.

No complicated setup. No lengthy onboarding. Submit your creative and your objective. Your results are waiting in Vibe Hub within 5 business days.

1
Submit your creative

Upload your video and tell us your study objective and target audience. One asset or multiple. We'll handle the rest.

You provide Video file(s) · Study goal · Target audience
2
We run the study

50+ real viewers watch your creative. We capture continuous facial emotional response, second by second, measuring valence, arousal, and attention throughout.

What happens Real viewers · Real facial response · No surveys · No claimed recall · Continuous emotional measurement
3
Results in Vibe Hub

Your full report lands in your secure client portal within 5 business days. Review scores, watch the timeline, share findings with your team.

You receive Vibe Resonance Score · Emotional journey · AI insights · KEEP/CUT guidance · Strategic recommendations
Choosing Your Audience
Every study needs a target audience.
You have two options. Here's how to think about which one fits your study.
General Population
The right choice for most studies. Structural creative issues like weak hooks, emotional dead zones, and pacing problems show up clearly in general population data. Most of the time, what's not working is not working for everyone.
Targeted Audience
Makes sense when your creative is built for a highly specific cohort. Think category-specific messaging, cultural nuance, or segments with distinct expectations. For general creative effectiveness, you'll often find the same things a targeted study would surface.
Not sure which fits? We'll help when you reach out.
Vibe Hub

Your results, waiting in your secure portal.

Every Vibe Study is delivered through Vibe Hub, your secure client portal, in 5 business days. Here's what's inside.

Vibe Hub
Second-by-second emotional data
Valence and arousal tracked continuously from real viewer facial response. Not surveys, not claimed recall. You see exactly when the audience leaned in and when they checked out.
Timestamped KEEP / CUT guidance
Every report tells your editor which moments to protect and which to cut, with the emotional data behind every call. No more creative politics. The data decides.
The Vibe Resonance Score
A single composite score combining attention and emotional quality. Use it to compare assets, track improvement over time, and benchmark against what good looks like in your category.
Watch and feel it in real time
Play your video in Vibe Hub and watch the emotional timeline respond second by second, so you can see exactly which frame caused which shift. No more guessing what "flat and informational" looks like in practice.
Real studies

What a Vibe Study finds.

Two anonymized examples. Real studies, real findings, real decisions made from the data.

Global Technology Brand Creative deep-dive · 3 assets · B2B
Which of three AI campaign videos drives the strongest intent-level response — and why is attention so high while resonance lags?
What Vibe found
All three assets scored significantly above average on attention (97–98). But emotional resonance landed in the average band — classified as "flat and informational." The gap revealed viewers were watching without feeling. The single strongest emotional moment across all three assets: a brief conversational AI exchange at seconds 12–16, where valence hit +100 and arousal peaked simultaneously.
The data gave the creative team a precise brief: more dialogue-driven AI interactions, less infrastructure imagery, CTA moved to immediately follow the emotional peak.
Leading CPG Brand Creative deep-dive · 60s spot · Awareness
Find the strongest 30-second cut from a 60-second spot — and identify exactly which frames to keep and which to cut.
What Vibe found
The 60s creative scored above average on both attention and resonance — validating the core concept. But the emotional analysis revealed the strongest positive response was concentrated entirely in the final product showcase, while the middle section — an extended animated sequence — produced high arousal without positive valence. The data pointed to sensory overload, not emotional connection.
Timestamped KEEP/CUT recommendations gave the editor a precise 30-second architecture: retain the opening hook, compress the animation to a single beat, maximize the product showcase window where valence peaked at +100.
The scores

Three metrics. One clear picture.

Every Vibe Study produces three metrics. Here's what each one means, and why the relationship between them tells you more than any single score can.

78.2
Vibe Resonance Score
The number that tells you if your creative is doing its job. A composite of attention and emotional quality. It captures whether viewers watched and how they felt while watching. This is your primary benchmark.
Excellent
90+
Above Average
80–89
Average
70–79
Below Average
60–69
Poor
<60
97.7
Attention Score
Are they watching? Or just there? The Attention Score measures the percentage of viewers actively engaged at each second. A high score means your creative holds attention. But attention alone isn't enough. You can watch something without feeling anything.
The attention trap
A creative can score 98 on attention and average on resonance — meaning viewers watched every second but never felt anything. Attention is a necessary condition. It's not a sufficient one.
Valence + Arousal
Emotional Quality
The difference between an ad people see and an ad people feel. Valence measures positivity or negativity (–100 to +100). Arousal measures intensity of emotional activation. Together they tell you what your audience felt and how strongly they felt it.
Buy Zone
Moments where both valence and arousal are simultaneously positive — the emotional state most correlated with purchase intent and brand recall.
Flat & informational
High attention, neutral emotion. The audience is processing — but not feeling. The most common creative ceiling for B2B and product-led campaigns.
In their words

What people say about Vibe

"No one is doing this."
Brian Dema
CEO, Department of Growth
Brian Dema on Vibe Analytics
Watch on YouTube
Get started

Ready to know what your audience actually feels?

Tell us where you are in the creative process and what question you're trying to answer. We'll come back with exactly how a Vibe Study can help.

Talk to us →

Or reach us directly: [email protected]